
What Pricing Looks Like When It Lives in Spreadsheets

A little while back, we asked the question, “Who actually owns pricing in your company?”
Today I’d like to ask, “Where does pricing live in your company?” If you’re a B2B manufacturer or distributor, there are almost certainly some prices in your ERP or order management system, but where did they come from? Where does your sales team look for current pricing when they need to quote and communicate them to customers? Where do those Pricing Guidelines that we talked about a couple weeks ago actually live?
For many people, if they were to ask where the pricing is, they’d get four Excel files. Two have the same name. None of them match what’s in the ERP. They’d be told the “current one” is on Bob’s laptop and he would forward it later. He would, sort of. It would end up being a copy of the third file they already had, with one row updated in red.
The truth is that for situations like this (which is extremely common), the company doesn’t actually have a price list. It has a folder. And the folder is alive, in the worst possible sense.
If your pricing lives in spreadsheets, it doesn’t actually live anywhere. It lives in 17 slightly different versions scattered across six people’s desktops, and the versions disagree.
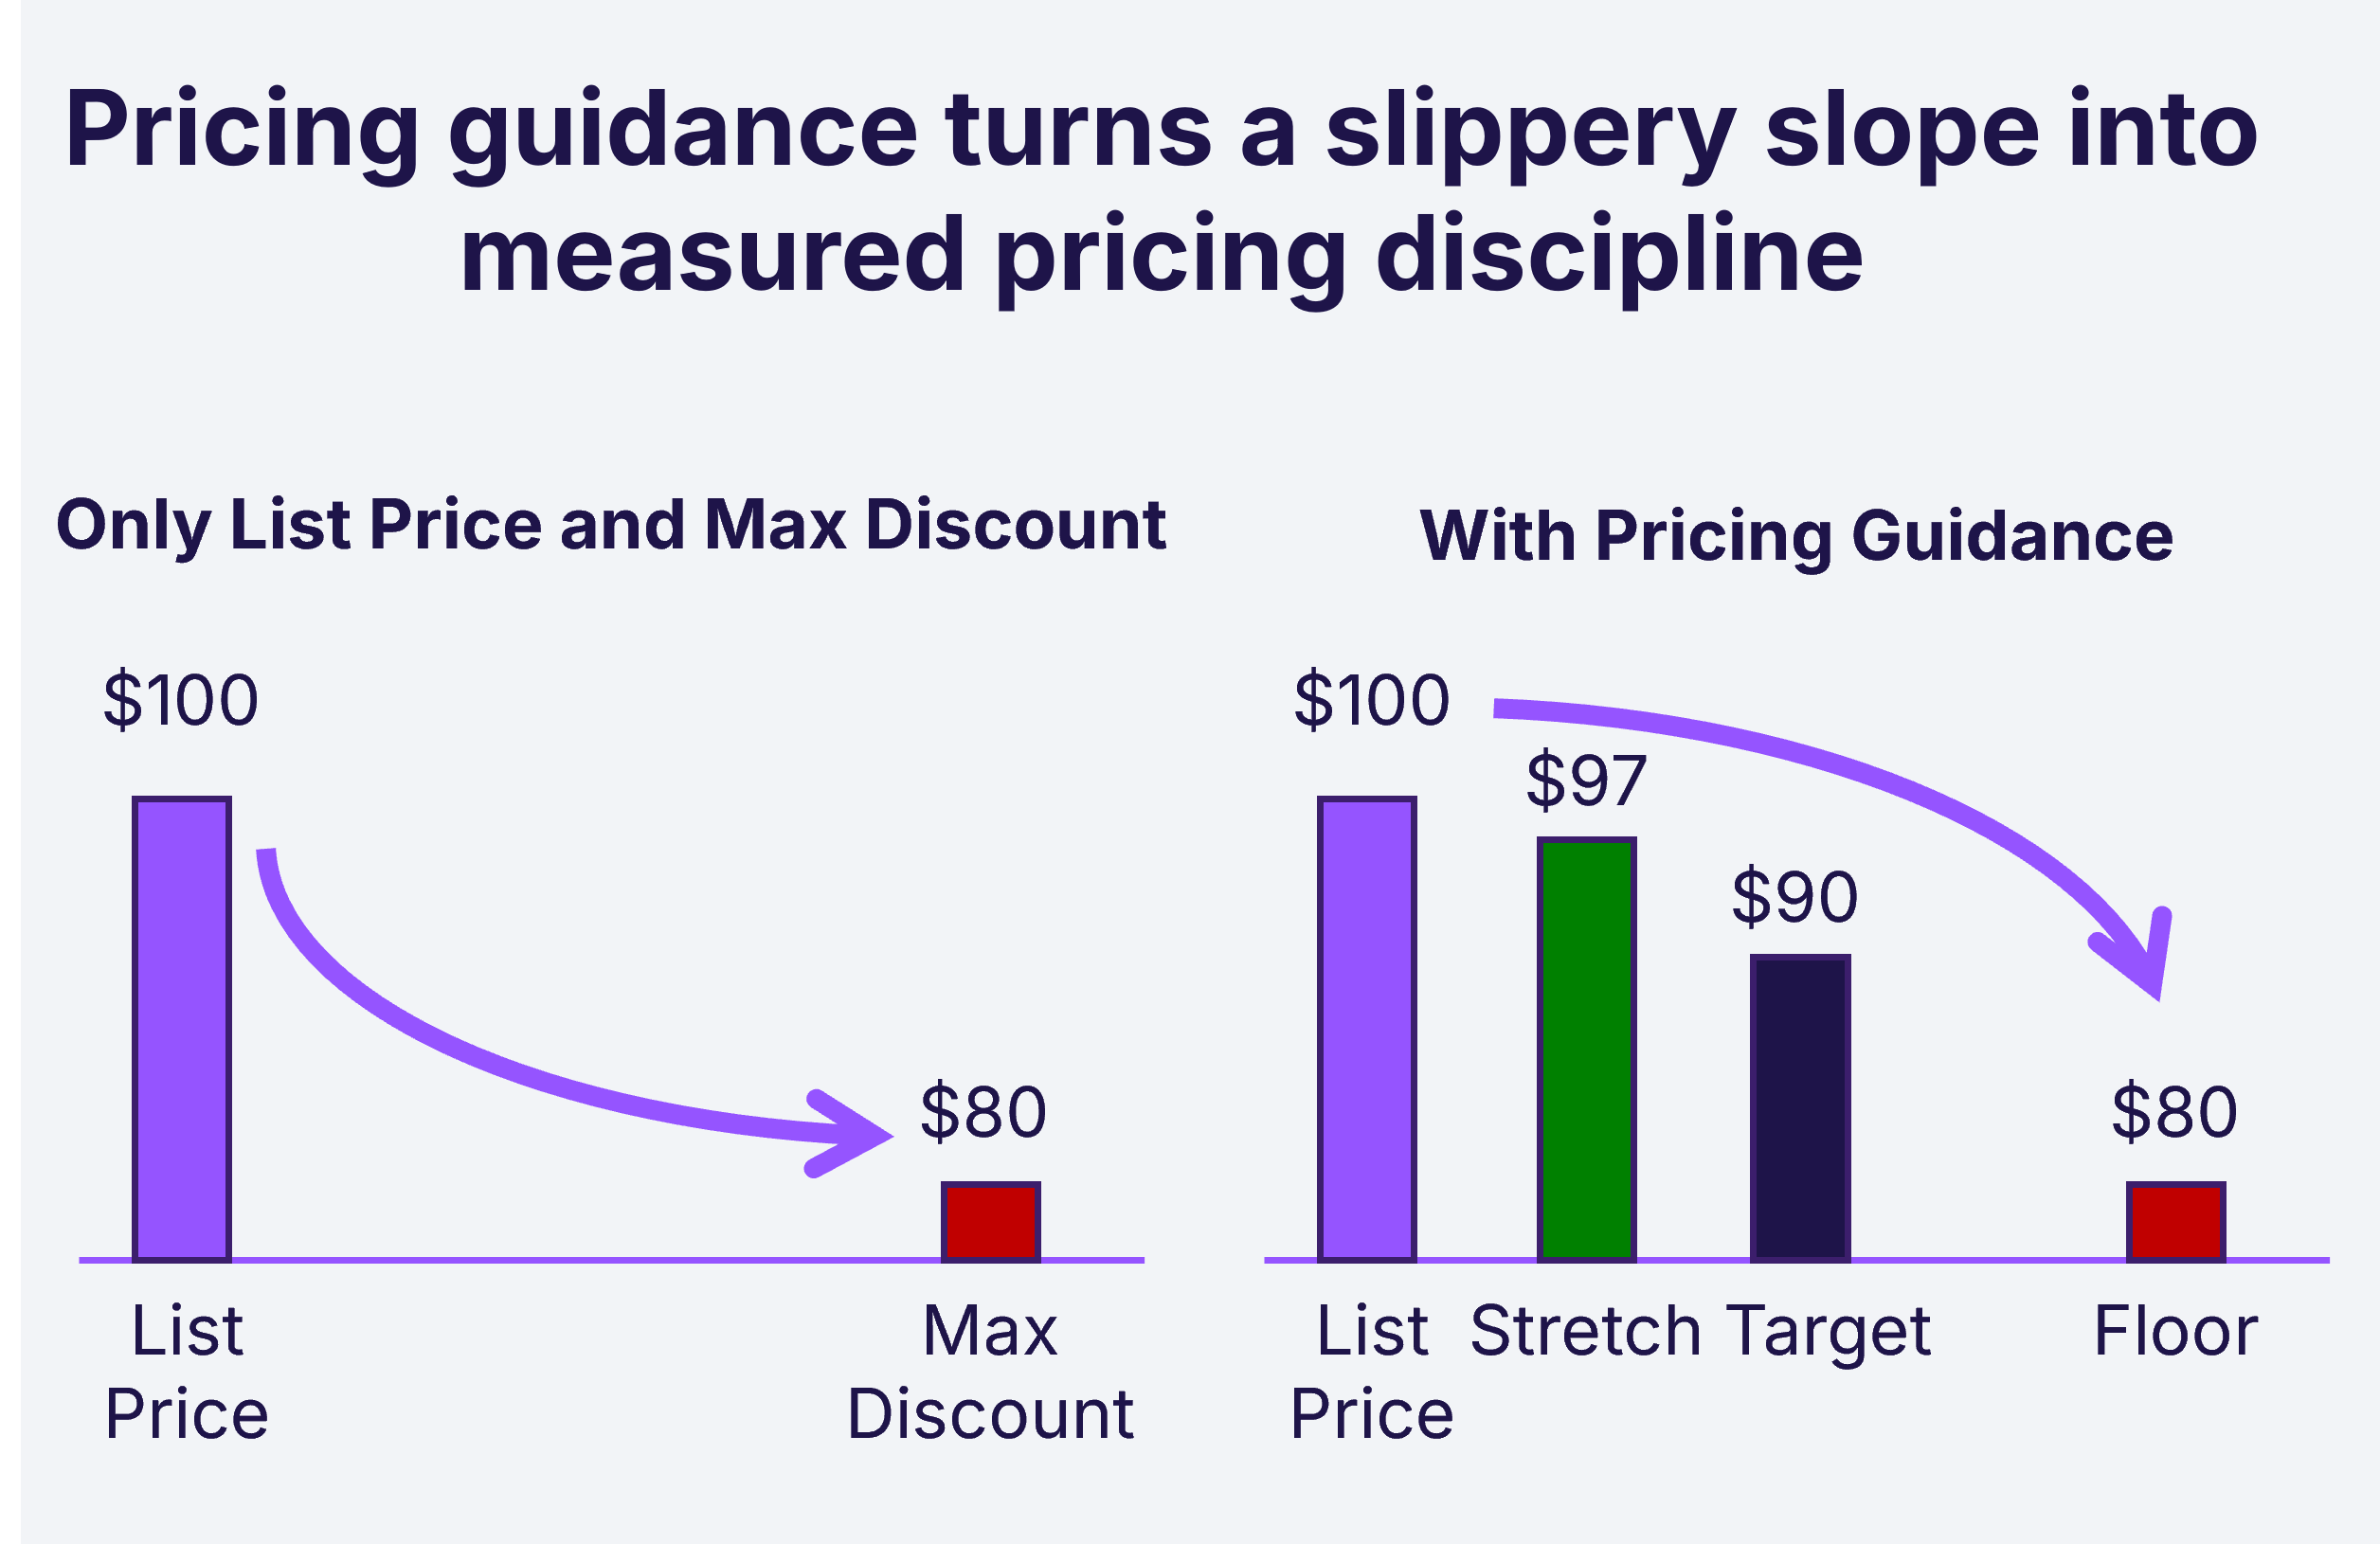
A couple weeks ago I wrote about pricing guidance: Target, Stretch, and Floor bands across a two-axis customer × category segmentation. That post closed with an honest question. Once you have those bands, where does the table actually live? In a spreadsheet on the sales manager’s laptop. Maybe two versions of it. Maybe four, by the time three regions have edited their own copies. All that good work of building guidance deteriorates and becomes moot inside the file system that holds it.
This post is what that situation actually looks like, what it costs in real dollars, and how to move beyond what I’ve heard referred to as “Excel Hell.”
How to tell if your pricing lives in spreadsheets
You’ll probably recognize most of these signs…
One file, many copies. There’s a “Master Pricing 2026.xlsx” somewhere, but only one person can confidently name where. Three regions have local copies named almost the same thing. None of the local copies were forked from the same version of the master.
Updates travel by email. A category manager raises gear-pump list pricing by 4%. The change goes out as a reply-all on a thread with seventeen people, a screenshot in the body, and an attachment named “Updated GP Pricing FINAL v2.xlsx.” Whether the regional managers actually open it is a coin flip. Whether the change makes it into the local quoting sheets is a different coin flip.
The ERP and the spreadsheet disagree. Customer-specific pricing in the ERP says one thing for Account #4017. The regional rep’s spreadsheet says something else, because the rep negotiated a freight charge discount last quarter and updated his own file, not the ERP. The quote goes out using his file. The invoice eventually goes out using the ERP. The customer notices. Customers don’t call you when you under-charge them, but they sure do when you over-charge them.
Discount approvals live in inboxes. A rep asks the regional manager for a 14% discount on a $90K order via email. The regional manager replies “OK.” Six months later, nobody can find the thread, nobody can explain the precedent, and a different rep on a different account uses that “OK” as justification for a similar concession on a customer that doesn’t deserve it.
Nobody can answer “what changed?” without an archeology project. When realized margin slips a hundred basis points on hydraulic motors quarter-over-quarter, the question is whether list went down, discounts went up, mix shifted, or costs increased. Pulling apart what actually happened requires four people, three days, and the kind of meeting where someone eventually says “let’s just call it mix.”
If you nodded at two or three of those, the sad truth is that your pricing lives… well, all over the place.
What this actually costs you
The cost of fragmented pricing data doesn’t show up as a line item. It hides inside familiar variances. A few of the most common patterns:
Drift between price book and actual price. Two reps quote the same SKU to similar customers and come back with quotes 6 percentage points apart on discount. Neither rep is wrong. They’re reading different files. The average realized price for that SKU is meaningfully below where the price book says it should be, but the price book isn’t the document being used to quote.
Stale escalations. Last year’s special pricing concessions never get reviewed the next time and those “special” considerations become baked into the status quo. The original justification (a competitive threat, a one-time volume commitment, a strategic logo) is long gone. The discount persists because nobody owns the file that records it. Two to four hundred basis points of realized margin can sit inside this pattern alone on a multi-year account.
Lost time at the quote moment. To try to find the right price, a sales rep might have to chase down multiple files across several people’s desks, and probably call their regional manager for air cover before they send the prices to the customer. This delay costs time, and time kills all deals. In many cases, the first quote wins the deal. And if this happens systematically, you’re talking about a significant win-rate tax driven by fragmented pricing and pricing guidance.
Audit and rebate exposure. When customer SPAs live in email and spreadsheets, customer-claimed rebates and credits in arrears are almost impossible to defend or refute confidently. AR pays them because nobody can prove otherwise. This is a recurring leak that’s rarely attributed to pricing at all.
For an industrial equipment manufacturer in the $200M to $500M range, 100 to 250 basis points of revenue is a common total for the bundle of leaks above. On, say, $280M, that’s $2.8M to $7M of margin that fragmented data is keeping you from defending. The actual recovery available is usually a fraction of that on the first pass, but only a fraction. The rest is structural and shows up over the following year.
Why a better spreadsheet is not the answer
The instinct, when you see the diagnosis above, is to build a better spreadsheet. A bigger master file. Locked-down tabs. Color-coded validation. A change log on row one. A nice naming convention and a stern email to the regional managers about not making local copies. We’ve all lived this.
Resist the temptation to make a better Excel file. Excel was never designed to be a business process (pricing) application, and it doesn’t become one by adding tabs or macros. It’s a single-user, file-based, in-memory calculator that you’ve been asking to behave like a multi-user, audited, integrated transactional system.
The honest answer is that pricing at your size needs a real application underneath it. Not because Excel is bad software (it’s not), but because the work pricing has to do at $280M of revenue and 50,000 SKUs sits outside of what any spreadsheet is built to handle. The signs in the section above aren’t symptoms of poor file hygiene. They’re symptoms of using a desktop productivity tool as enterprise software.
What a real pricing system has to do
Five capabilities as a checklist of requirements, not suggestions:
1. One source of truth for every price you publish. List price, customer-specific pricing, special-price agreements, rebate terms, freight rules, all in one application with versioned change history, role-based permissions, and one human owner. There’s no “which copy is current” question because there’s only one copy. Evaluate by asking: if pricing for SKU X changes today at 9 a.m., can three people in three regions see the new number on their screen by 9:05, without anyone forwarding a file?
2. Price-waterfall awareness, not just list-price. The system computes pocket price (list net of every off-invoice deduction), and margin at the transaction level by joining invoice data with rebate accruals, freight settlements, and payment-term effects. Without this, every margin conversation is a guess and every margin investigation is a three-day workbook build. Evaluate by asking: can your CFO see the top 20 customers’ pocket-price and margin distribution by SKU on demand, without an analyst being pulled off something else for a week?
3. Direct integration with the quote moment. The rep cannot see a number that disagrees with the system, and cannot quote outside policy without a visible flag and an approval path. CPQ, ERP quoting screen, embedded helper next to the CRM, whatever the form factor is, the system has to be at the rep’s fingertips when they pick the number. Evaluate by asking: if I sit next to a rep tomorrow and watch them build a quote, do they ever open a separate file? (Ideally they wouldn’t.)
4. Governance built in, not bolted on. Every price change carries a who, when, why, and approver inside the system. Discount authority lives in the application, not in an email thread. SPAs have effective and expiration dates the system enforces (auto-flagging renewals, auto-blocking quotes that fall outside their scope). Evaluate by asking: can you produce a clean audit trail for the last 12 months of pricing changes on your top 10 customers without your cube starting to look like you’re trying to unravel the latest conspiracy theory?
5. An analytics layer your pricing and finance leaders can actually use. True realized price… by customer, SKU, rep, and quarter. Variance from guidance bands. Price-Volume-Mix variance analyses for customers, for products, etc. The pricing function has to answer the CFO’s questions in the meeting, not the week after.
To be clear, this is not a replacement for your current BI platform, and it’s not trying to be. Tableau, Power BI, Looker, and your data warehouse aggregate whatever data you point them at. They do not natively understand what pocket price is, what a Target/Stretch/Floor band means, or which deals fell outside policy. A pricing system’s analytics is a capability of the pricing system itself, built around the same data model as the other four items in this list. That shared model is what lets it answer pricing questions on demand instead of after a month of dimensional modeling by your data team. Your general BI stack still has the rest of the business to run. The two work alongside each other.
Evaluate by asking: when realized margin slips 100 basis points on a product line, can someone tell you within a day whether it was list, discount, mix, or costs?
These are the five things any pricing application has to deliver to actually replace the folder. A system that does the first four but lacks the analytics layer leaves you blind to whether the rest is working. A system with a great analytics layer but no integration to the quote moment is a report card, not a control surface. The bar is all five.
While you can attempt to customize your ERP, CPQ, or CRM system to be able to handle these, it’ll be costly and you’ll end up stuck with a brittle and rigid system you’d like to burn down in a couple years. Shameless promotion: Revomo was built for exactly this purpose, by industry veterans who have decades of battle scars, with the latest technology and processes. Why would that matter? Because now you can get all 5 of these key requirements, implemented in weeks, not years… at the cost of adding one junior analyst to your team.
What changes when pricing has a real system
For a $280M industrial equipment manufacturer that gets the five capabilities in place (in any form), the operating picture inside two quarters typically looks like this:
- A single owned pricing system the whole sales organization references, with no parallel local files in circulation
- Price-waterfall visibility on the top 80% of revenue, refreshed at least weekly, available to sales and finance simultaneously
- Reps quoting inside an environment that shows them list, applicable guidance band, and approval path on the same screen
- A clean audit trail and SPA register that finance and legal can actually use
- Realized price recovery between 75 and 250 basis points of revenue inside two quarters. On $280M that’s roughly $2.1M to $7M of margin per year, recurring. The recovery comes from arresting drift, surfacing leakage that was previously invisible, and giving the reps a defensible target instead of a slippery slope.
Those ranges are what companies typically see when they retire the folder, stop using desktop productivity tools for this, and adopt an application that does the five things above.
Where to start tomorrow
Start by doing an honest assessment of where you are today. Take the five capabilities above, and score your current setup against each one on a 0-to-2 scale. Zero means “we don’t do this at all.” One means “we do this informally, in one person’s head or one file.” Two means “this is a real system with an owner and a process.”
The maximum score is 10. If you’re above 7, you have a stronger pricing foundation than most companies in your peer group and the next step is targeted improvement. If you’re between 4 and 7, the cracks are visible and most of the leakage in your business is captured by what you can’t do today. If you’re below 4, the folder is the bottleneck and every other pricing initiative will under-deliver until it’s replaced.
Take whatever score you get to your CFO and your VP of Sales. If you want a second pair of eyes, shoot us a message. We can help you for free. Show them the math: leakage at 100 to 250 basis points of revenue, on your revenue base, sitting unaddressed quarter after quarter. The conversation that follows is the one your business has been waiting on you to start.
You’ll know what to do next, and it’ll be something you’ll really enjoy because you can make a measurable impact on your business, with your name attached to the success.
This is the close of a three-part arc on the smallest pricing function that does real work. The starter kit (who can say no), the guidance (Target, Stretch, Floor), and the system that holds it all together (this post) are the three things every pricing function eventually needs, regardless of size.
.avif)
in your inbox every week


in your inbox every week