


.png)
Smarter pricing starts
With smarter insights
Revomo analyzes millions of transactions across products, customers, and markets to expose what’s working, what’s leaking, and what to do next.
Detect Opportunities & Risks
Spot hidden price, margin, and revenue risks using AI-driven detection.
Isolate Trends & Anomalies
Find seasonality, behavior shifts, or lifecycle patterns in noisy data.
Identify Performance Drivers
Link pricing actions to profit, win rates, and deal velocity.
Segment Customers and Products
Group SKUs or customers by sensitivity, profitability, and discount behavior.
Analyze Variance Causes
Uncover real reasons behind margin shifts, costs, or competitor moves.
Forecast Business Outcomes
Predict revenue, margin, and volume impact using historical and external signals.
Activate Smart Alerts
Trigger alerts for margin erosion, price breaches, or demand shifts.
Track Compliance Metrics
Report on policy compliance, pricing governance, and operational KPIs.
Monitor Market Intelligence
Track competitor moves, commodity indices, and regulatory shifts automatically.

AI Native Analytics to Deliver Self-service at Scale
Revomo unifies charts, dashboards, insights, alerts, and reports into a real-time, interactive analytics layer powered by live data and AI


Visual Intelligence
Turn raw data into clarity with real-time intelligence that aligns teams, surfaces risks, and accelerates decisions.

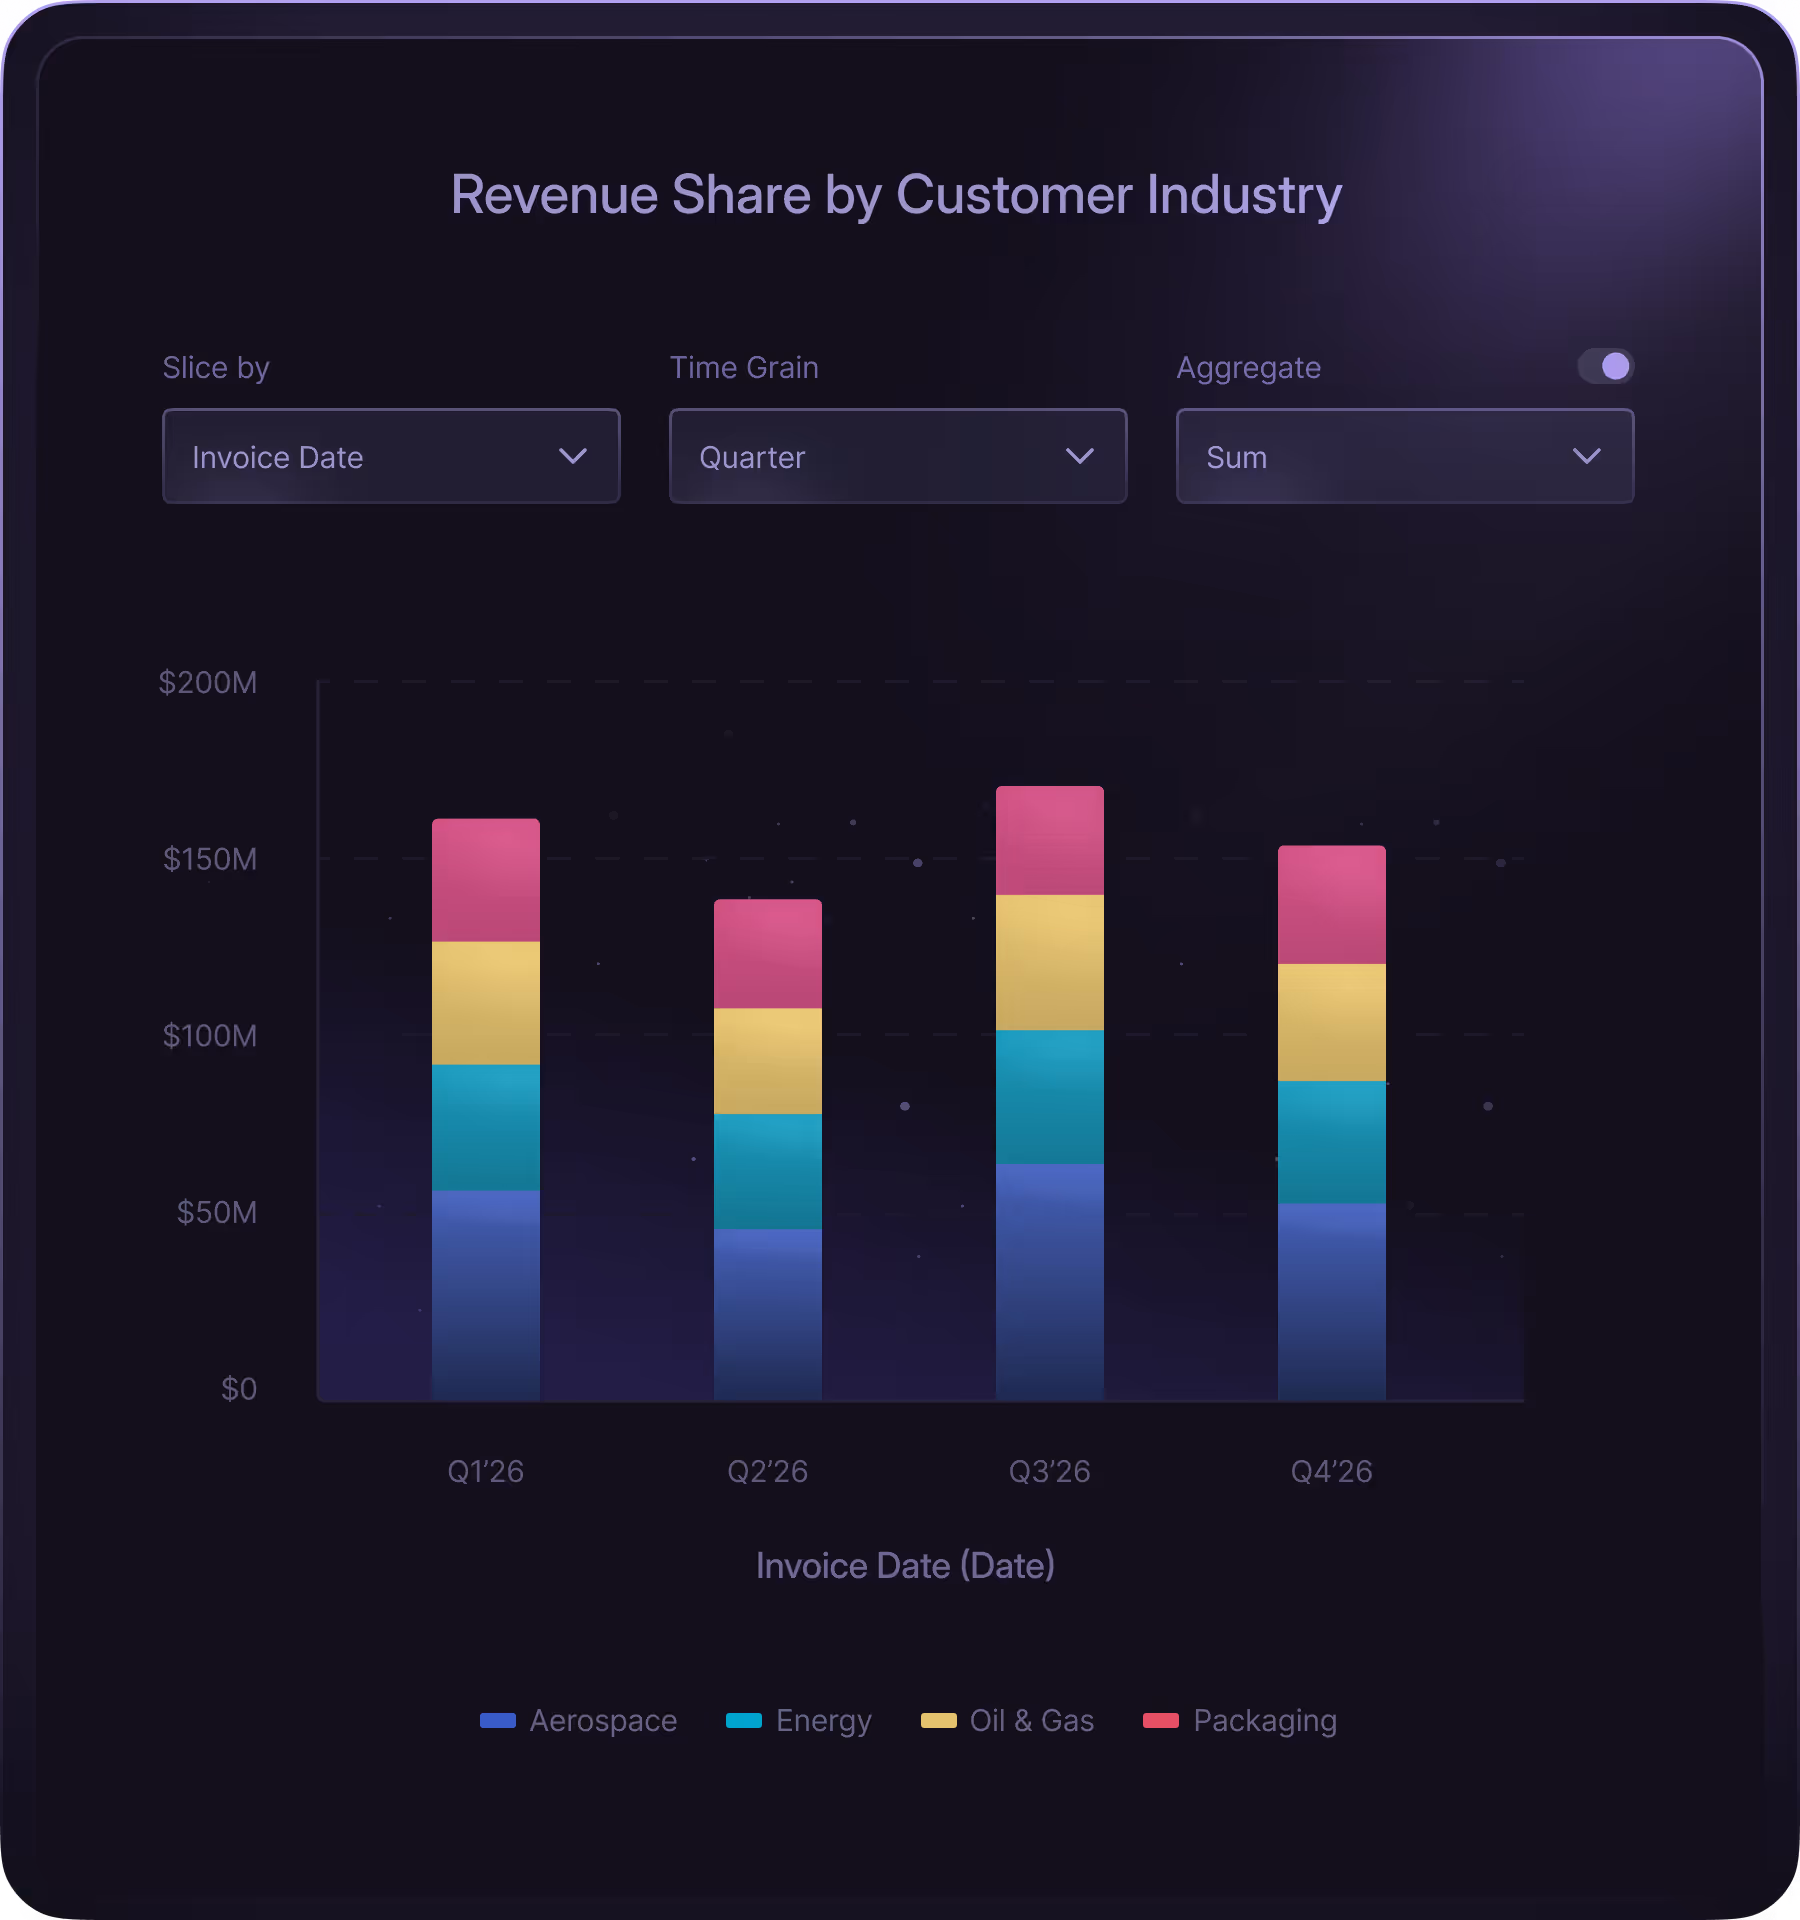
Uncover margin and revenue signals with contextual charts generated by AI.
Drill into SKUs, regions, or customers to understand trends, not just see them.
Visualize drivers, not just deltas with guided narratives for pricing teams and executives.

Performance Command Center
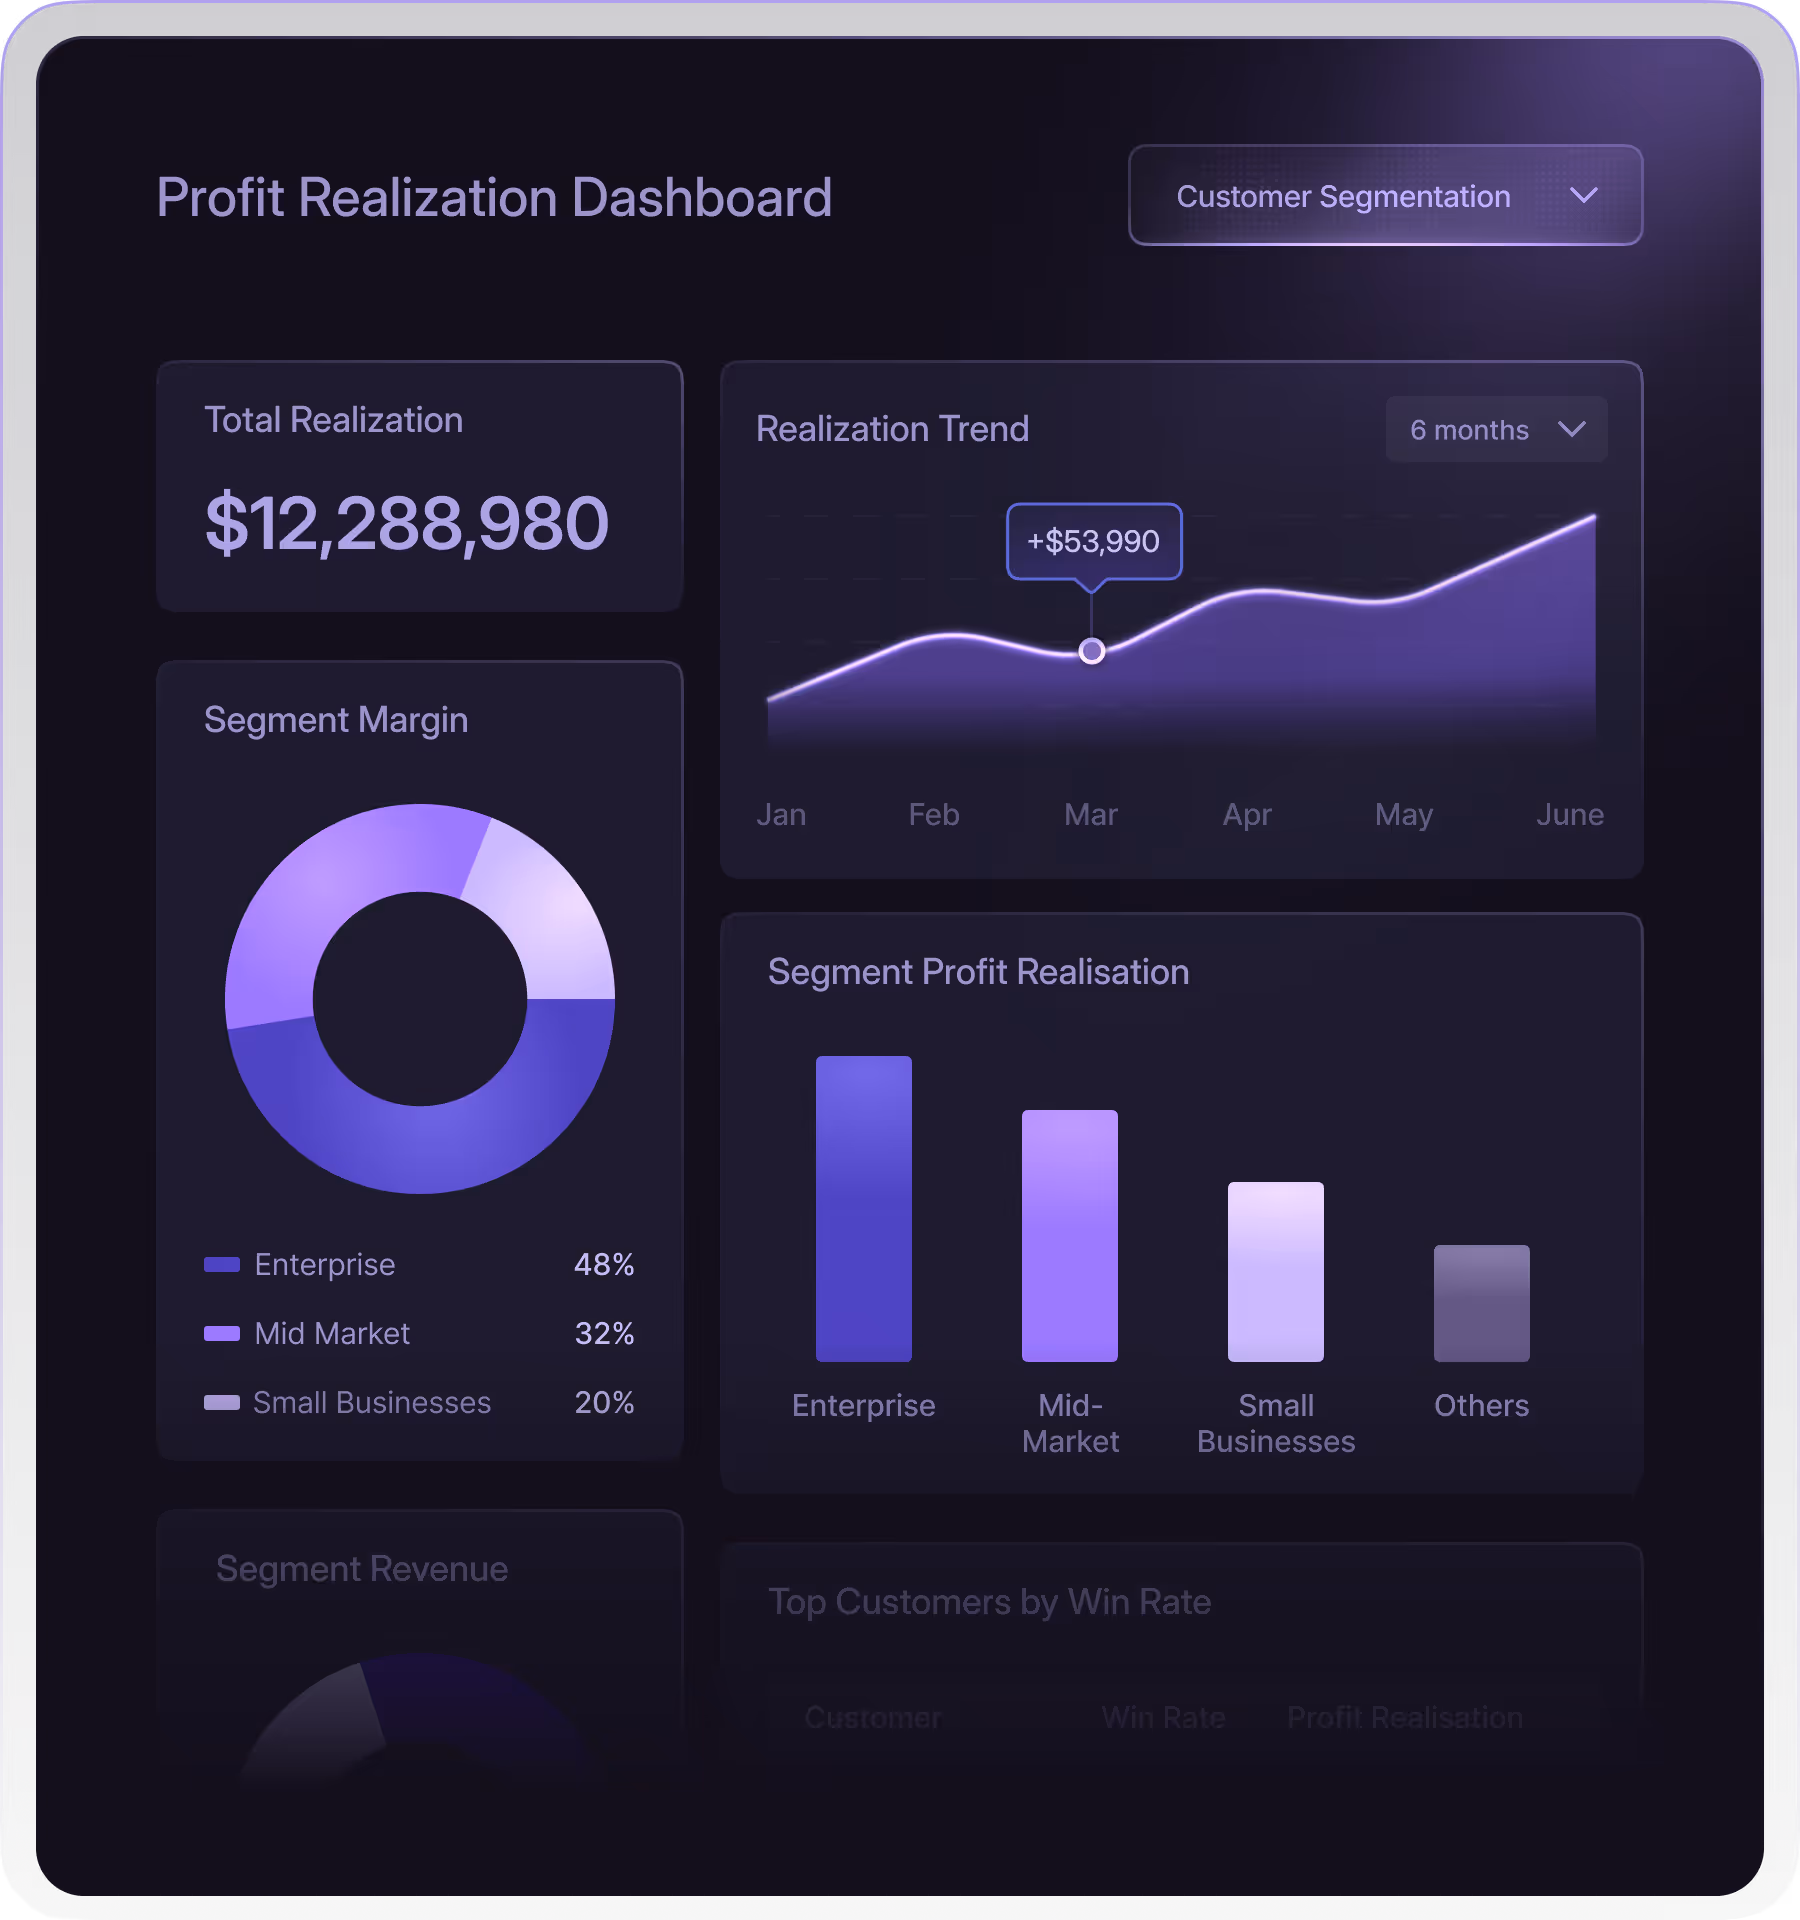
Make pricing performance transparent with real-time intelligence that aligns teams, surfaces risks, and accelerates decisions.
Design persona-based dashboards for finance, sales, or pricing leadership in minutes.
Monitor key pricing KPIs like price realization, discount leakage, and profit contribution.
Connect insight to action with embedded workflows that make dashboards more than just displays.


.avif)

Actionable Insights
Transform analysis into guidance with real-time intelligence that aligns teams, surfaces risks, and accelerates decisions.
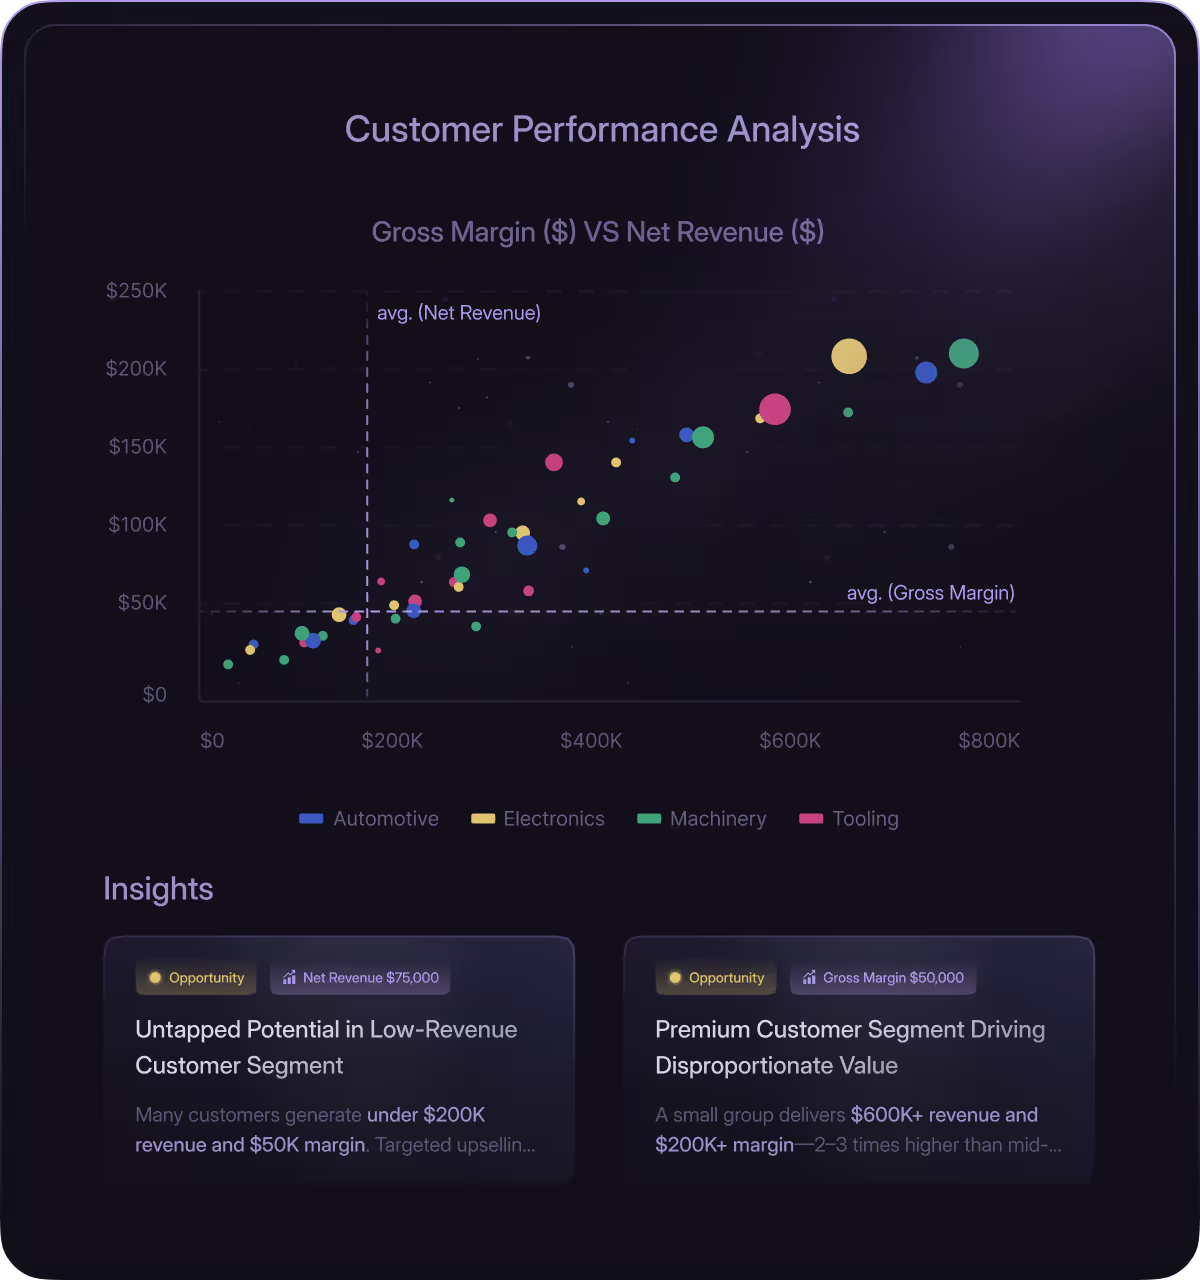
AI pinpoints opportunities and risks across price, margin, and volume dimensions.
Understand the “why” behind changes with causal and correlative insight layers.
Move from lagging to leading with forward-facing guidance embedded in every module.
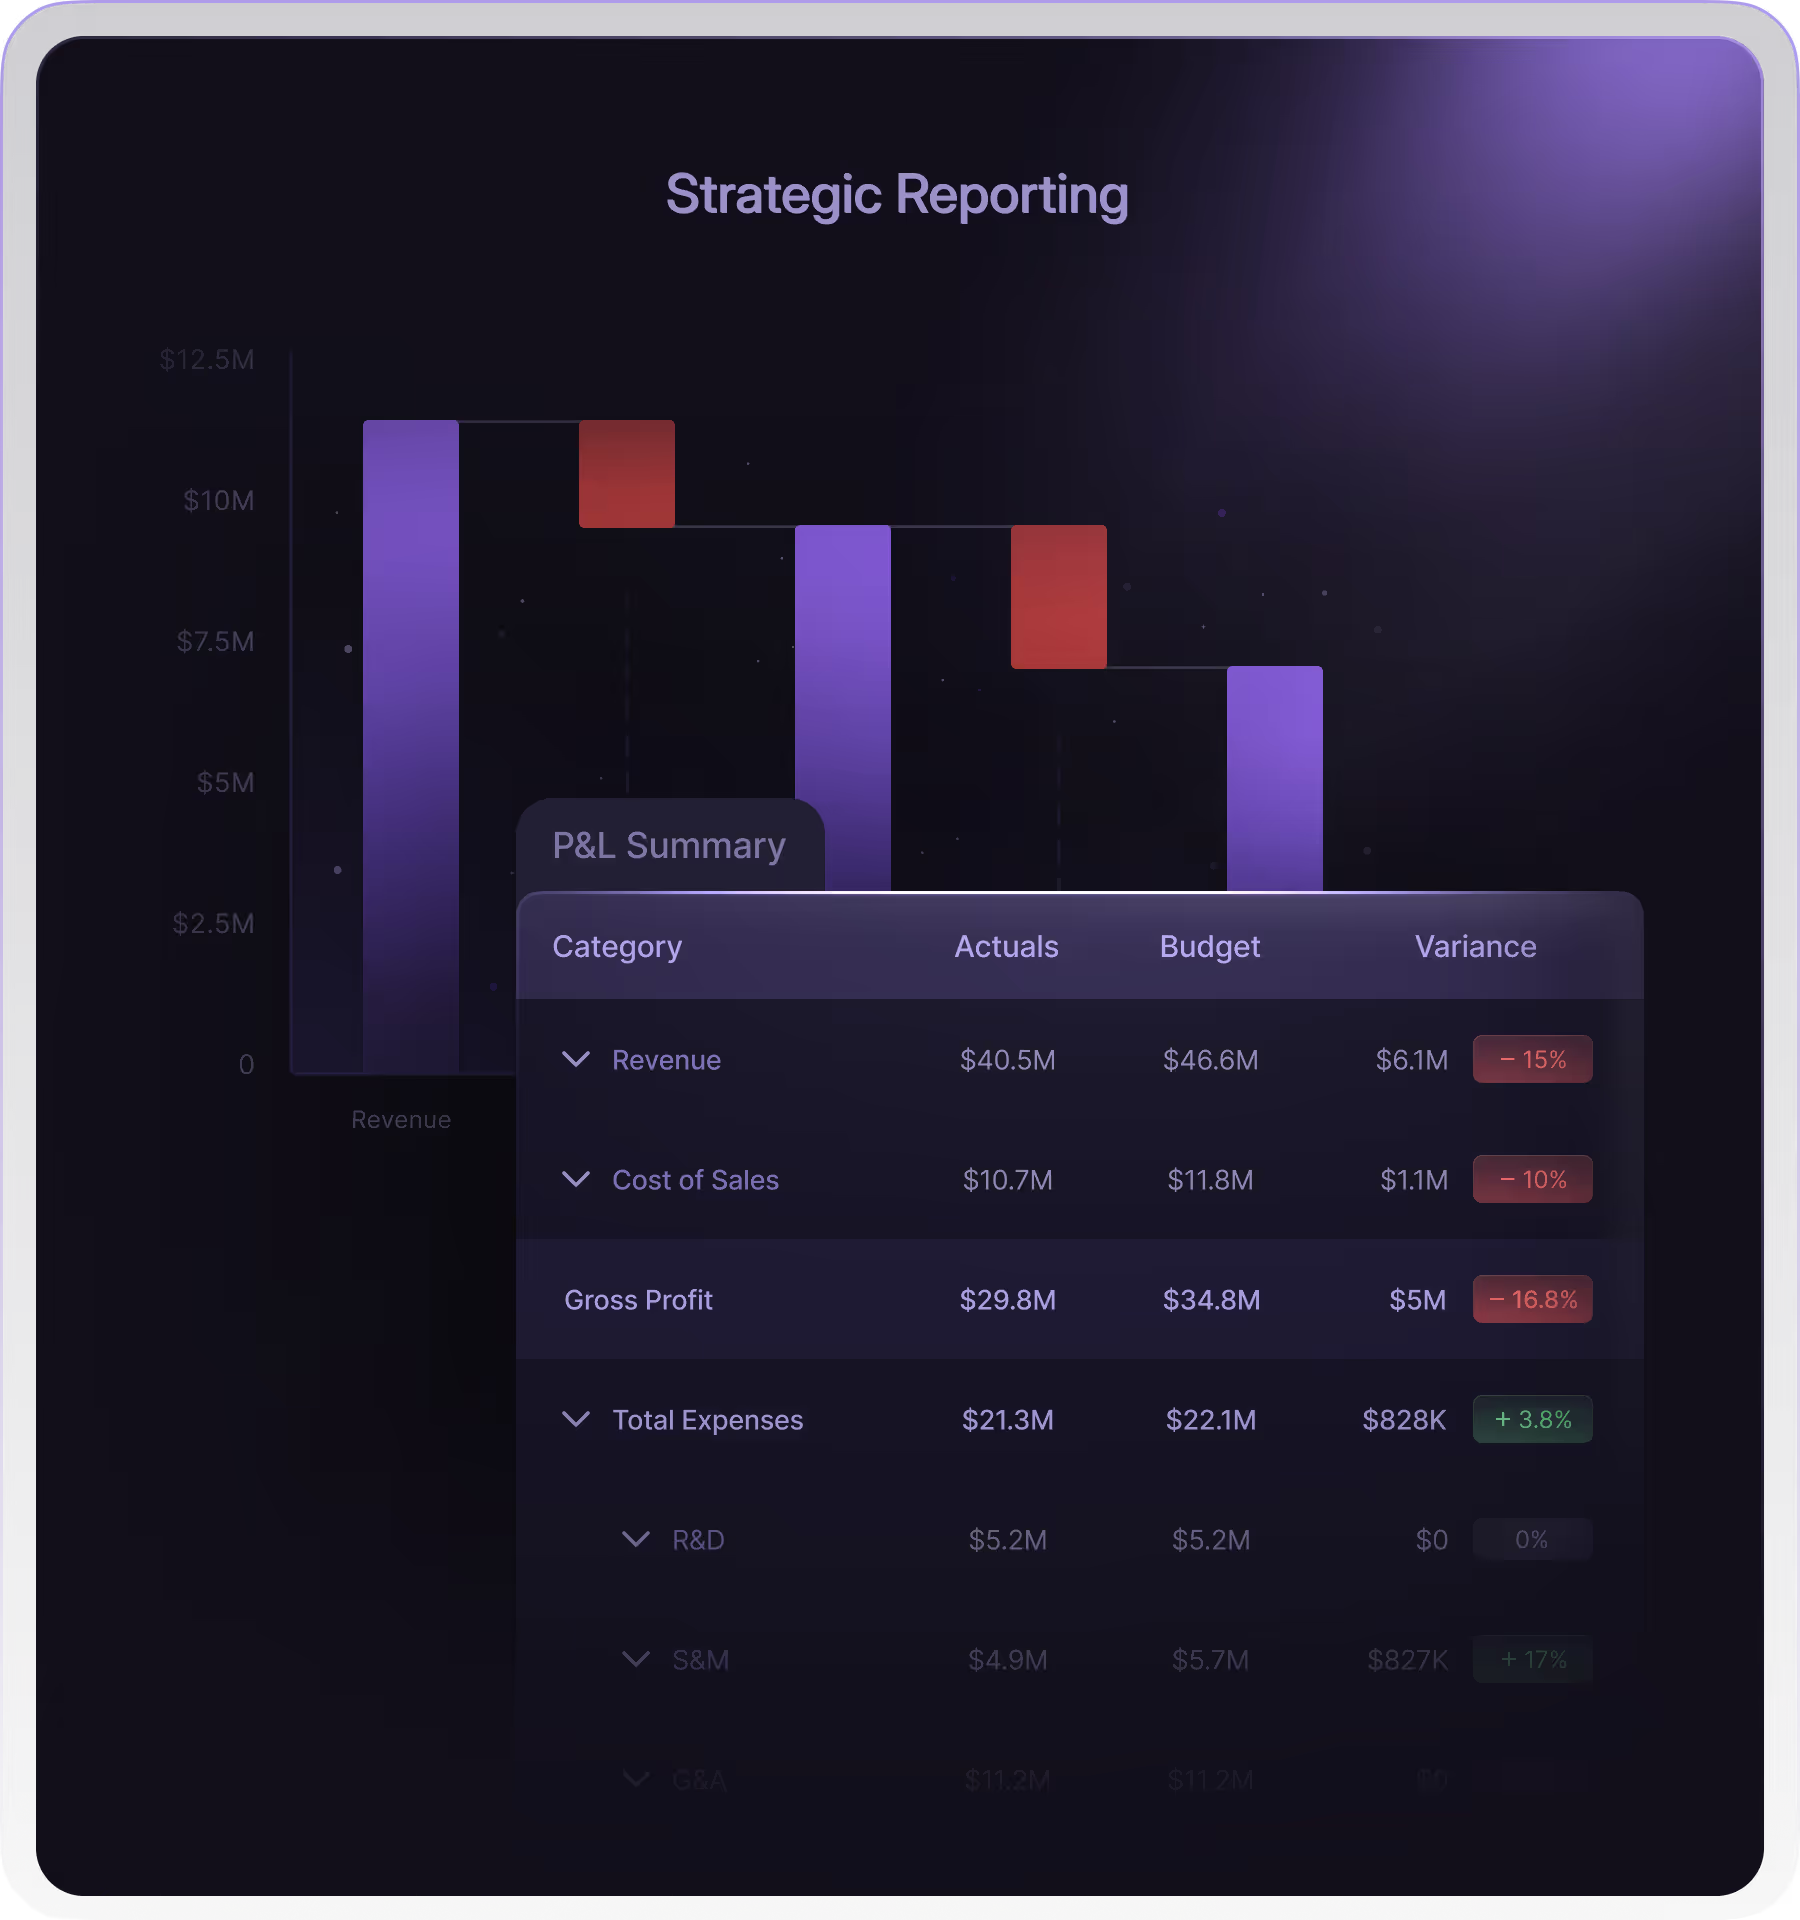
Strategic Reporting
Evolve reporting into impact with real-time intelligence that aligns teams, surfaces risks, and accelerates decisions.
Auto-generate pricing, compliance, and margin reports for every stakeholder
Schedule and distribute insights across teams with no manual compiling required.
Embed narratives into every PDF or dashboard so reports guide decisions, not just track them.
Smart Alerts
Stay ahead with smart and proactive alerts that rank risks, trigger actions, and guide teams with explainable, real-time intelligence.

Top news
Shape your product ideas. Ideate and specify what to build next. Work on proposals and discuss

Expose, Benchmark, Prove ROI
Turn pricing noise into clarity that CFOs and boards can trust.
Expose Margin and Discount Leakage
See profit loss from list to pocket.
Benchmark and Diagnose Performance
Compare regions and SKUs, and uncover root causes in minutes.
Deliver Fast and Transparent ROI
Prove measurable gains within 30 days.


Common Questions. Answered For You
What analyses come out of the box with Revomo?
Revomo includes pre-built dashboards for revenue, margin, and pricing performance. You can analyze trends, customer mix, and product profitability right from day one.

.avif)
How does Revomo identify revenue and margin leakage?
It compares actual prices and margins against targets, then highlights where profit slips through on-invoice adjustments such as discounts, cost-to-serve elements such as freight, or off-invoice incentives such as rebates. You will get visibility to exactly where money is lost.
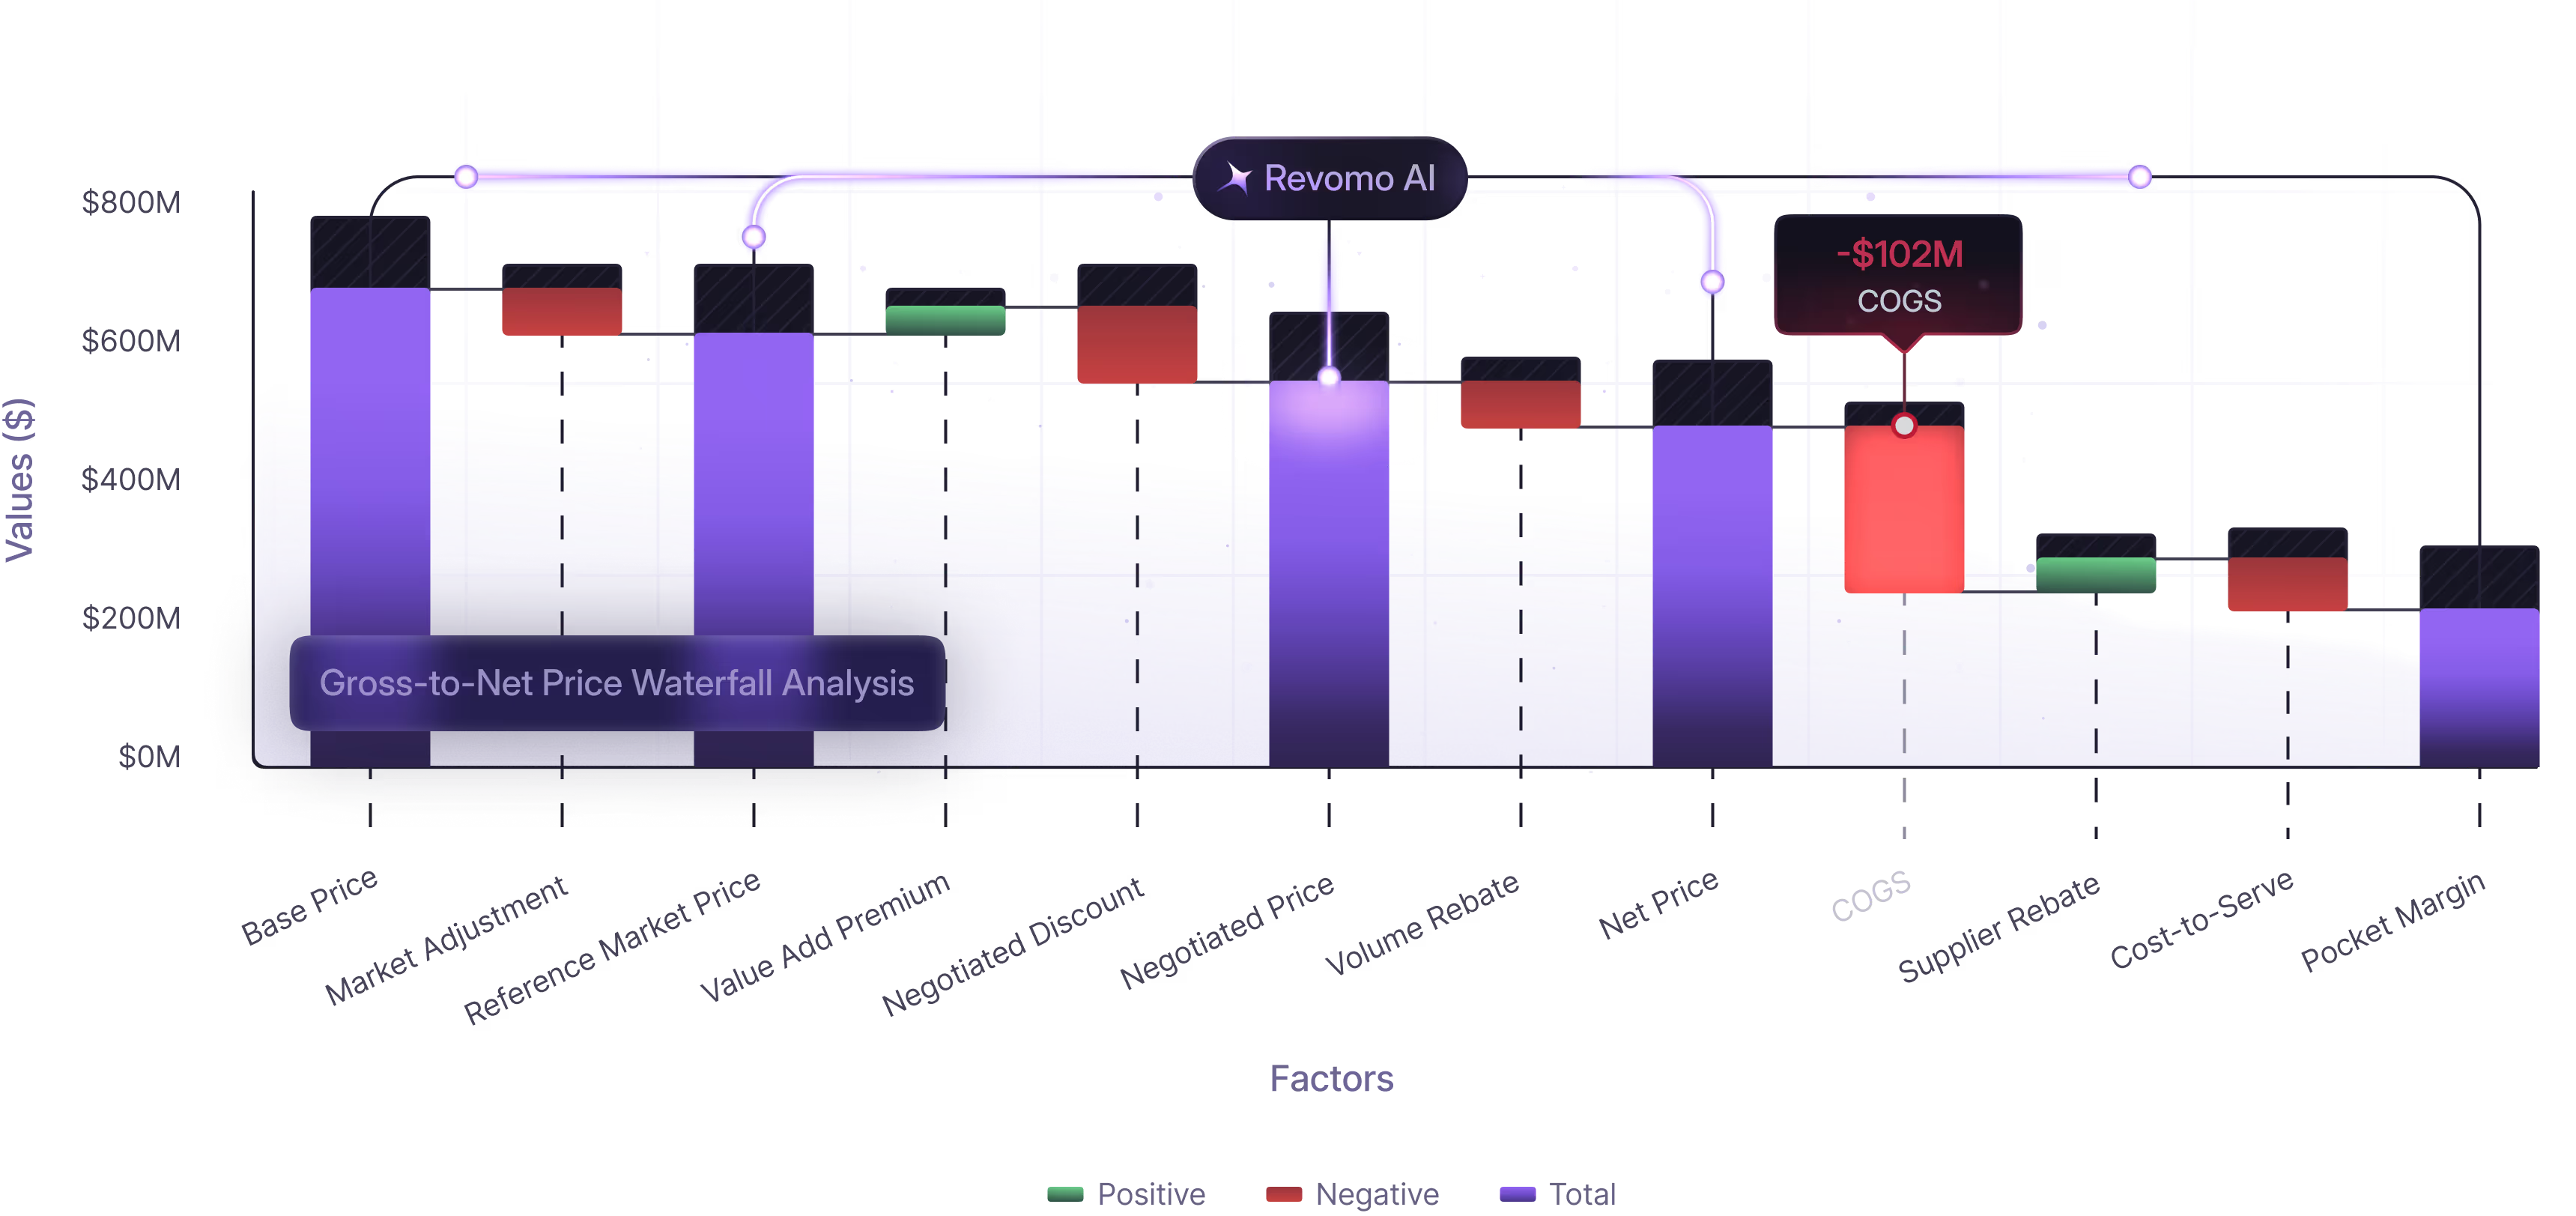
What is a price waterfall, and how does it reveal hidden profit drains?
The price waterfall shows how you move from list price to final pocket margin. It visually exposes every step where revenue and margin leaks through costs or discounts or incentives and surfaces opportunities to recover profit or fix pricing risk before it grows.
Can I view profitability by customer, region, or product hierarchy?
Yes. You can drill down by any combination of customer, product or geography hierarchy dimensions to see which segments drive or dilute profit.
How are dashboards organized?
Dashboards are grouped by business function and role, so executives, pricing managers, and sales teams each see what matters most to them.
Can users create their own reports or only use predefined ones?
Both. Revomo comes with ready-to-use dashboards, and users can easily build or customize new ones without coding.
What makes Revomo’s analytics more business fluent than generic BI tools?
Revomo is built for pricing, not just data visualization. It speaks your business language with metrics like pocket margin, price realization, and cost-to-serve already modeled in.
What are alerts, and how do they work in Revomo?
Alerts in Revomo act like an early warning system for your business. They continuously scan performance data for margin drops, price inconsistencies, or unusual trends. When something important happens, the right people are instantly notified with context and next-step recommendations.
What are insights in Revomo, and are they actionable?
Insights in Revomo highlight what’s driving your KPIs — from margin dips to growth opportunities. Each one is labeled for e.g. as an opportunity, risk, or cost improvement, often with a dollar value showing potential impact. You can act right away by reviewing prices, adjusting strategy, or running a simulation to capture the gain or fix the loss.
How does AI help generate insights in Revomo?
AI in Revomo scans all your sales, cost, and pricing data to spot hidden patterns and trends. It explains why performance changes, quantifies the impact, and labels each finding as an opportunity or risk so you can act fast and confidently.
What makes Revomo better than the tool I’m using now?
Revomo connects data, analysis, and action in one place. It’s faster to set up, easier to use, and built with AI that delivers clear, measurable insights instead of static reports — helping you uncover profit faster and make smarter pricing decisions.
How does Revomo connect analytics to planning and forecasting workflows?
Revomo links every insight to future action. Patterns in sales, margin, or cost trends feed directly into forecasting models, helping teams plan smarter, test scenarios, and turn today’s performance data into tomorrow’s pricing strategy.

